Signal Processing
2023. 11. 8. 22:31ㆍ학습/ML4ME[23-2]
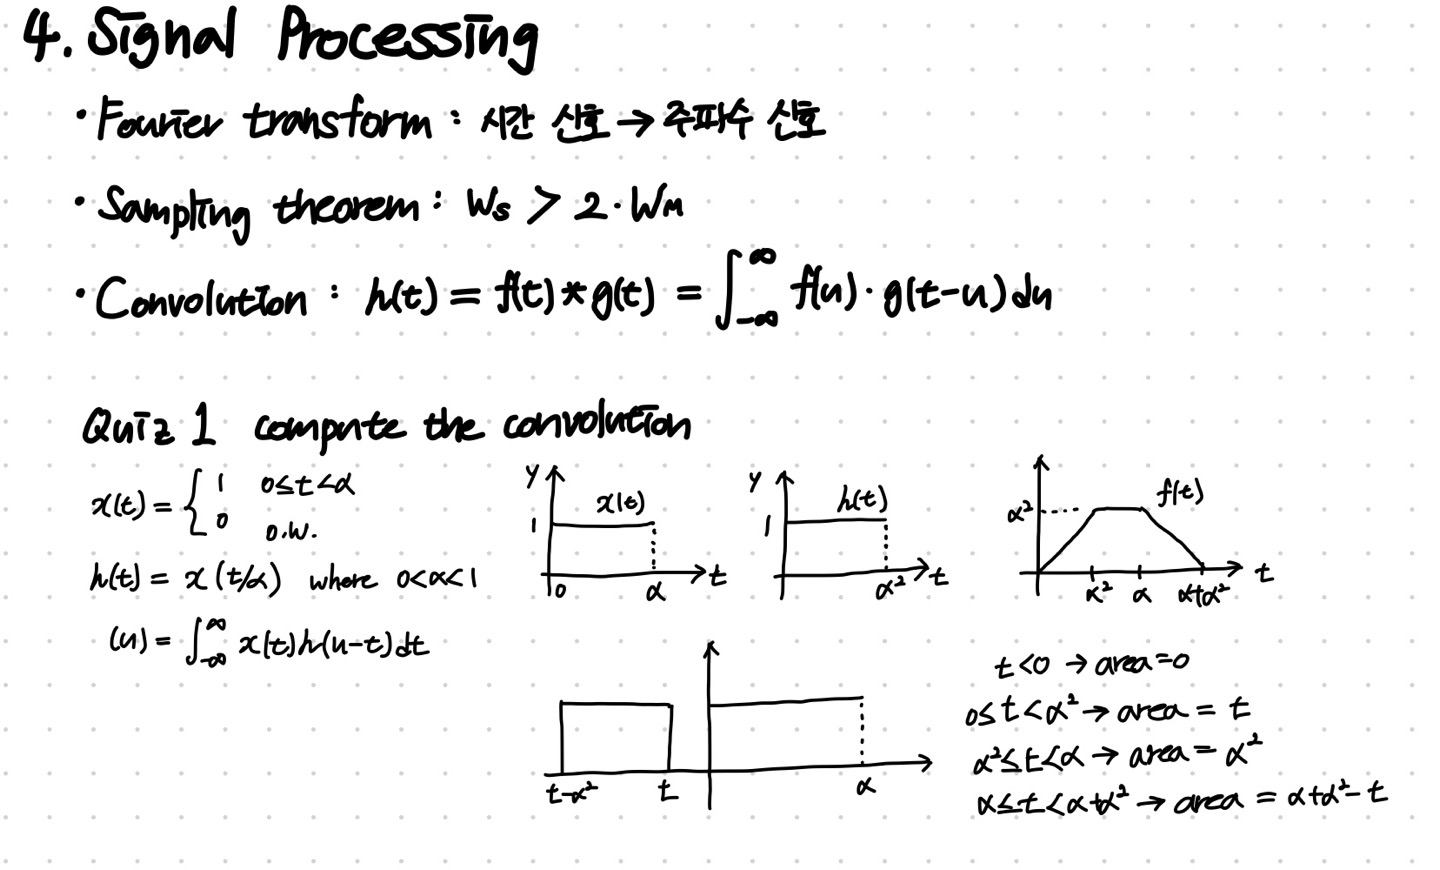
Quiz 2
import numpy as np
import matplotlib.pyplot as plt
from elice_utils import EliceUtils
elice_utils = EliceUtils()
def plt_show():
plt.savefig("fig")
elice_utils.send_image("fig.png")
def do_fft():
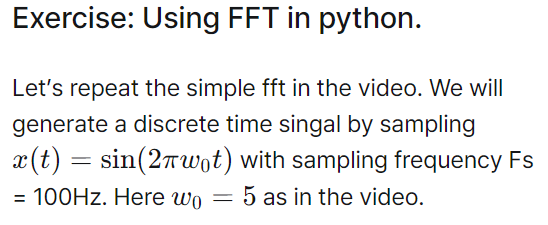
# (a) generate
Fs = 100 # sampling frequency 100Hz
t = np.arange(0, 2+1/Fs, 1/Fs) # signal duration 0~2 seconds
w0 = 5 # dominant frequency in the signal
x = np.sin(2*np.pi*w0*t) # x(t)=sin(2pi w0 t)
# plot signal
plt.figure(1)
plt.plot(t, x)
plt.grid(True)
plt.xlabel('t')
plt.ylabel('x(t)=sin(5 pi t)')
plt_show()
# (b) fft using numpy fft
X = np.fft.fft(x) #TODO # X=fft(x)
freq = np.linspace(0, Fs, len(X)) #TODO # freqency axis (w-axis)
'''np.linsapce(시작, 끝, 샘플 수)'''
# (c) let's see only the half
X = X[:len(X)//2] #TODO # X=fft(x)
freq = freq[:len(freq)//2] #TODO # freqency axis (w-axis)
'''절반만 보이는 이유는 대칭이기 때문'''
return freq, X
def main():
freq,X = do_fft()
# plot frequency domain
plt.figure(2)
plt.plot(freq, np.abs(X))
plt.grid(True)
plt_show()
if __name__ == "__main__":
main()
Quiz 3

from elice_utils import EliceUtils
import numpy as np
import matplotlib.pyplot as plt
import cv2
from answer import convolution_2D
elice_utils = EliceUtils()
def plt_show():
plt.savefig("fig")
elice_utils.send_image("fig.png")
def plot_images(images, titles):
for i, image in enumerate(images):
'enumerate()는 인덱스와 원소로 이루어진 튜플을 만들어 줌'
plt.subplot(1, len(images), i+1)
'subplot(nrows, ncols, index)'
plt.imshow(image, cmap='gray')
plt.title(titles[i])
plt_show()
def my_convolution_2D(image, kernel):
# Complete this part for additional bonus points
pass
return 0 # replace this part with your output
def sobel():
kernel = np.array([[-1, 0, 1], [-2, 0, 2], [-1, 0, 1]])
return kernel
def blur():
kernel = np.array([[1, 2, 1], [2, 4, 2], [1, 2, 1]])
return kernel
def laplacian():
kernel = np.array([[0, 1, 0], [1, -4, 1], [0, 1, 0]])
return kernel
def shadow():
# Emboss filter
kernel = np.array([[-2, -1, 0], [-1, 1, 1], [0, 1, 2]])
return kernel
def main():
image1 = cv2.imread("./pikachu.jpg", cv2.IMREAD_GRAYSCALE)
image2 = cv2.imread("./Lenna.png", cv2.IMREAD_GRAYSCALE)
result = convolution_2D(image2, sobel())
'어떤 필터 쓸 건지 선택'
# Visualizations. Don't touch this line
plot_images([image2, result], ["Original", "Convolved"])
if __name__ == "__main__":
main()
'학습 > ML4ME[23-2]' 카테고리의 다른 글
| Parametric Density Estimation: Binary variable distribution (0) | 2023.11.12 |
|---|---|
| Probability (0) | 2023.11.09 |
| Linear algebra for ML (0) | 2023.11.08 |
| Optimization Quiz (0) | 2023.11.08 |
| Optimization (0) | 2023.11.07 |